Google Lighthouse is a powerful open source tool used to analyze website performance, accessibility, SEO, and adherence to best practices. It provides developers and website owners actionable insights to optimize their sites. However, Lighthouse often flags errors that can seem overwhelming. This guide will help you understand, diagnose, and fix google lighthouse errors to improve your website’s user experience and search rankings.
What is Google Lighthouse?
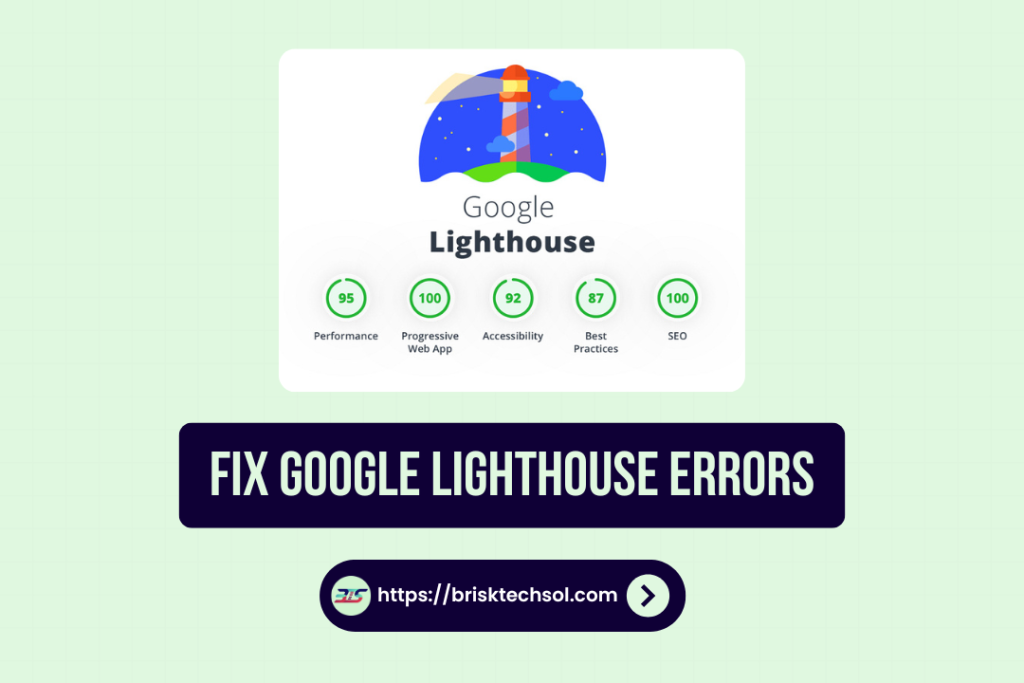
Google Lighthouse is an automated tool that evaluates web pages based on specific metrics. It provides scores across five categories: Performance, Accessibility, SEO, Best Practices, and Progressive Web Apps (PWAs). This tool is available as a Chrome DevTools feature, a browser extension, and a command-line interface.
How Does Lighthouse Work?
Lighthouse simulates a user visiting your website, analyzing how quickly and efficiently the site loads, functions, and interacts with users. It assigns scores on a scale of 0–100 for each category, highlighting areas of improvement.
Why Should Businesses Care?
- Core Web Vitals Impact: Metrics like Largest Contentful Paint (LCP), Cumulative Layout Shift (CLS), and First Input Delay (FID) directly influence SEO rankings.
- Improved User Experience: A higher Lighthouse score translates to faster loading times, better navigation, and accessibility, improving user retention.
- Competitive Edge: Optimized sites rank higher, leading to more visibility and conversions.
Common Google Lighthouse Errors
Key Lighthouse Categories:
| Category | Purpose |
|---|---|
| Performance | Evaluates loading speed, interactivity, and visual stability. |
| Accessibility | Tests usability for all users, including those with disabilities. |
| Best Practices | Flags outdated technologies or insecure practices. |
| SEO | Ensures the site is optimized for search engine crawlers. |
| Progressive Web Apps (PWA) | Checks for features like offline capability and manifest configuration. |
1. Performance Errors
- Slow LCP: Indicates delays in rendering the largest visible content on the page. Causes include large unoptimized images and slow server response times.
- High FID: Measures the time from when a user first interacts with your site to when the browser responds. Heavy JavaScript execution often contributes to this issue.
- Poor CLS: Caused by unexpected layout shifts, such as dynamic ads or undefined image dimensions.
2. Accessibility Errors
- Missing or incorrect ARIA roles (e.g., using
role="button"without appropriate attributes). - Low contrast between text and background colors, making content hard to read.
- Poor keyboard navigation, especially for interactive elements like forms and menus.
3. SEO Errors
- Missing meta tags (e.g., meta descriptions, alt attributes).
- Unminified CSS or JavaScript affecting loading times.
- Absence of structured data, reducing content visibility in search engines.
4. Best Practices Violations
- Using outdated libraries or frameworks that could introduce vulnerabilities.
- HTTP instead of HTTPS, risking user data security.
- Improper PWA configurations, such as missing service workers.
Resolving Performance Issues
1. Optimizing Largest Contentful Paint (LCP)
LCP measures the time it takes for the largest visible element (e.g., hero image, headline) to load.
- Use responsive images with next-gen formats like WebP.
- Implement lazy loading for images and videos.
- Serve static assets via a content delivery network (CDN).
2. Reducing First Input Delay (FID)
FID tracks the delay between a user interaction (e.g., clicking a button) and the browser’s response.
- Minify JavaScript: Use tools like Terser or UglifyJS.
- Defer Non-Critical Scripts: Load critical resources first.
- Reduce reliance on third-party scripts.
3. Addressing Cumulative Layout Shift (CLS)
CLS measures visual stability. Frequent issues include shifting content and ads.
- Always define width and height for media.
- Preload fonts to prevent unexpected layout changes.
- Avoid injecting content above existing elements during load.
Performance Metrics Explained
| Metric | Meaning | Ideal Score |
|---|---|---|
| First Contentful Paint (FCP) | Time to display the first visual element. | Below 2 seconds |
| Largest Contentful Paint (LCP) | Time for the main content to load. | Below 2.5 seconds |
| Cumulative Layout Shift (CLS) | Measures visual stability during load. | Below 0.1 |
Accessibility Improvements
1. Addressing Common Accessibility Issues
- Use semantic HTML tags (e.g.,
<header>,<footer>,<article>) to structure content. - Add descriptive alt attributes to images for screen readers.
2. Enhance Visual Accessibility
- Use tools like Contrast Checker to ensure adequate contrast ratios.
- Avoid relying on color alone to convey information; use icons or text labels.
3. Improve Keyboard Navigation
- Ensure all interactive elements (e.g., buttons, links) are reachable via the
Tabkey. - Add
:focusstyles to indicate which element is currently active.
Boosting SEO with Lighthouse Insights
1. Keyword Optimization
- Include primary and secondary keywords in titles, headers, and meta descriptions.
- Use schema markup for FAQs, reviews, or events to improve SERP visibility.
2. Mobile-Friendly Design
Lighthouse checks for responsive design. Ensure layouts adjust seamlessly to various screen sizes.
3. Page Load Speed
- Compress images and enable browser caching.
- Use a fast hosting provider optimized for your site’s traffic needs.
Implementing Best Practices
1. Upgrade to HTTPS
Non-secure connections are flagged by Lighthouse, affecting trust and ranking. Use SSL certificates.
2. Avoid Outdated Libraries
Replace old JavaScript or CSS libraries with actively maintained versions.
3. Optimize PWAs
If using a Progressive Web App, ensure proper service worker implementation and an accurate manifest.json file.
Case Study: Real World Lighthouse Optimization
Scenario:
A retail site scored poorly on Lighthouse due to oversized images and unminified code.
Steps Taken:
- Resized images using WebP and implemented lazy loading.
- Minified JavaScript and CSS with Webpack.
- Moved tracking scripts to asynchronous loading.
Results:
- Lighthouse performance score improved from 50 to 89.
- Conversion rates increased by 15% due to faster load times.
Key Takeaways
- Optimize Performance: Use responsive images, lazy loading, and minify code to improve your Largest Contentful Paint (LCP) and reduce First Input Delay (FID).
- Enhance Accessibility: Add alt attributes to images, maintain proper tab order, and ensure sufficient contrast for visual elements.
- Boost SEO: Use keyword-rich titles, responsive design, and fast-loading pages to rank higher in search engines.
- Adopt Best Practices: Upgrade to HTTPS, avoid outdated libraries, and ensure proper PWA implementation.
- Regular Audits Matter: Conduct Google Lighthouse audits frequently to identify and address errors as your website evolves.
FAQ’s About Google Light House Errors
What are the most common Google Lighthouse errors?
Performance, accessibility, SEO, and best practices issues like slow load times, missing alt text, and outdated libraries.
How do I improve my Lighthouse performance score?
Optimize images, defer non-essential scripts, and minimize JavaScript.
Does Lighthouse affect Google rankings?
Indirectly, yes. Metrics like Core Web Vitals influence SEO, and Lighthouse audits these factors.
What causes poor accessibility scores in Lighthouse?
Missing alt attributes, low contrast, and improper ARIA roles are common culprits.
How does Lighthouse impact Core Web Vitals?
Metrics like LCP, CLS, and FID, assessed by Lighthouse, are part of Core Web Vitals, crucial for SEO rankings.


